The report
One report, from bacteria to breakfast
Each report reads one sample in layers: the microbiome, the scores built from it, the food on the plate and the options around it. It is written for the practitioner and the individual to read together.
Four layers, one sample
- 7.4Diversity35Microbiome age
01
Microbiome profile
An estimated microbiome age in years, diversity on a 0 to 10 scale, and key bacterial groups shown against a reference population.
- Carbohydrate metabolism66Vitamin synthesis54| Community average. Illustrative values.Sugar index27
02
Gut scores
13 scores, each on a 0 to 100 scale and shown against a community average. They cover areas such as macronutrient metabolism, vitamin synthesis, sugar and processed food indices, bowel mobility and sleep quality.
- Illustrative values
 8, Enrich
 6, Balanced
 2, Eat less
03
Food scores
More than 300 foods in 14 categories, each scored from 0 to 10 for this individual’s microbiome.
- ProbioticTher-Biotic Factor 410, EnrichPrebioticInulin6.4, Balanced
04
Supplement suggestions
Prebiotic and probiotic options from a wider database, each scored from 0 to 10 for the profile. The report shows up to 10 of each. Probiotic options need shotgun or long-read sequencing data.
- GoodWellness Index
05
Wellness Index
A single rating, such as Good, shown in each report. It comes from a deep-learning model published in Biomedical Signal Processing and Control (2025).
- Illustrative planMTWTFSS
06
Personal diet plan
The planner in the Enbioma app builds a personal diet plan automatically from the microbiome data.
Three bands on the plate
- 8 to 10
Enrich
Enrich the diet with these foods.
- 4 to 7
Balanced
Eat these as part of a balanced and varied diet.
- 0 to 3
Eat less
Eat less of these foods.
A food score describes how a food fits this microbiome profile. It is not a food intolerance test. Foods someone avoids for medical, religious or personal reasons stay off the plate.
One profile, eight foods
Sorted by score, as in the report.
 BroccoliVegetables9, Enrich
 WalnutsNuts and seeds8, Enrich
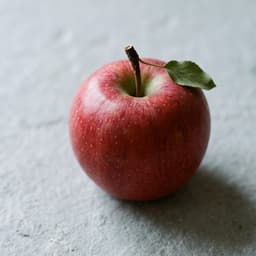
 AppleFruit8, Enrich
 Rolled oatsGrains7, Balanced
 PearFruit6, Balanced
 Green lentilsLegumes6, Balanced
 Plain yoghurtDairy4, Balanced
 White breadBakery2, Eat less
Illustrative values. The report lists more than 300 foods in 14 categories.
How to read it


- 1Start with the overviewDiversity and the gut scores sit on one page.
- 2Read each score against its bandScores describe a pattern in the microbiome profile. They are not a diagnosis.
- 3Move to the foodBegin with the enrich band, then the foods to eat less.
- 4Review supplement options with a practitionerOptions are ranked for the profile, not prescribed.
- 5RetestA second report shows how the profile has changed.
Associations, not diagnoses
Partners can switch on optional modules that show what published research has linked to microbiome patterns similar to this profile. These modules report associations from published research. They are not a diagnosis or a risk assessment, and each partner decides whether to include them.

Your brand, their language
Languages
More than 20 languages, and others on request.
Branding
Your logo and colours on every report.
Formats
PDF, and in the Enbioma app.
Turnaround
Usually ready within 30 minutes of the FASTQ upload.
Read a full report
Open a full sample report, made from a demo shotgun sample, and see every layer page by page.
Food scores
- BroccoliVegetables9, Enrich
- AppleFruit8, Enrich
- PearFruit6, Balanced
- Plain yoghurtDairy4, Balanced
- White breadBakery2, Eat less
Illustrative values